

Decoding Data: How Visualisation improves Enterprise Asset Management and Strategic Decision-Making

In today's interconnected business environment, data is crucial for strategic decision-making. With many choices of IoT devices, organisations can now collect data more effectively, and various SMART data interpretation engines available on the market can help analyse them. However, the sheer amount of data collected can be overwhelming, making interpretation problematic and time-consuming. According to Forbes Technology Councils, 90-80% of the world’s data is unstructured, and only 18% of companies actively use it. IBM notes that according to IDC, 60–73% of all data is unused.
The Role of IoT Sensing and SMART Data Interpretation
Organisations aim to focus on information that directly impacts their core operations, is interpreted and can be acted upon. They strive to concentrate on specific metrics filtered out by utilising IoT sensors collecting real-time data on equipment and machinery performance. Businesses can track and compare quantitative insights from measurable data to assess performance improvements or declines and create predictive models based on historical data trends to optimise performance, improve logistics operations, save costs and better service delivery.
The Power of Visualisation
The human brain's ability to process images 60,000 times faster than words is not merely a function of perception but a significant leverage point for business technology. Visualisation is a transformative force in interpreting and utilising IoT data, harnessing human cognitive strengths to enhance decision-making and operational effectiveness. Visualisation technologies distil complex, word-based data and use relevant software to transform them into intuitive graphical insights, making data manageable, accessible and immediately understandable. This transformation is critical in an era where real users often bypass manuals in favour of direct interaction with data. The need for intuitive interfaces familiar to users and utilising real-life images and visual cues significantly accelerates the human comprehension process. By implementing well-designed visuals, organisations can ensure that seasoned experts and casual users can grasp intricate data sets at a glance. Visualisation bridges complex data environments and practical business execution, empowering a broader workforce to e
ngage meaningfully with technology and drive more value from their interactions with data. The result is a streamlined, more efficient operational model that capitalises on informed decision-making powered by visual clarity.
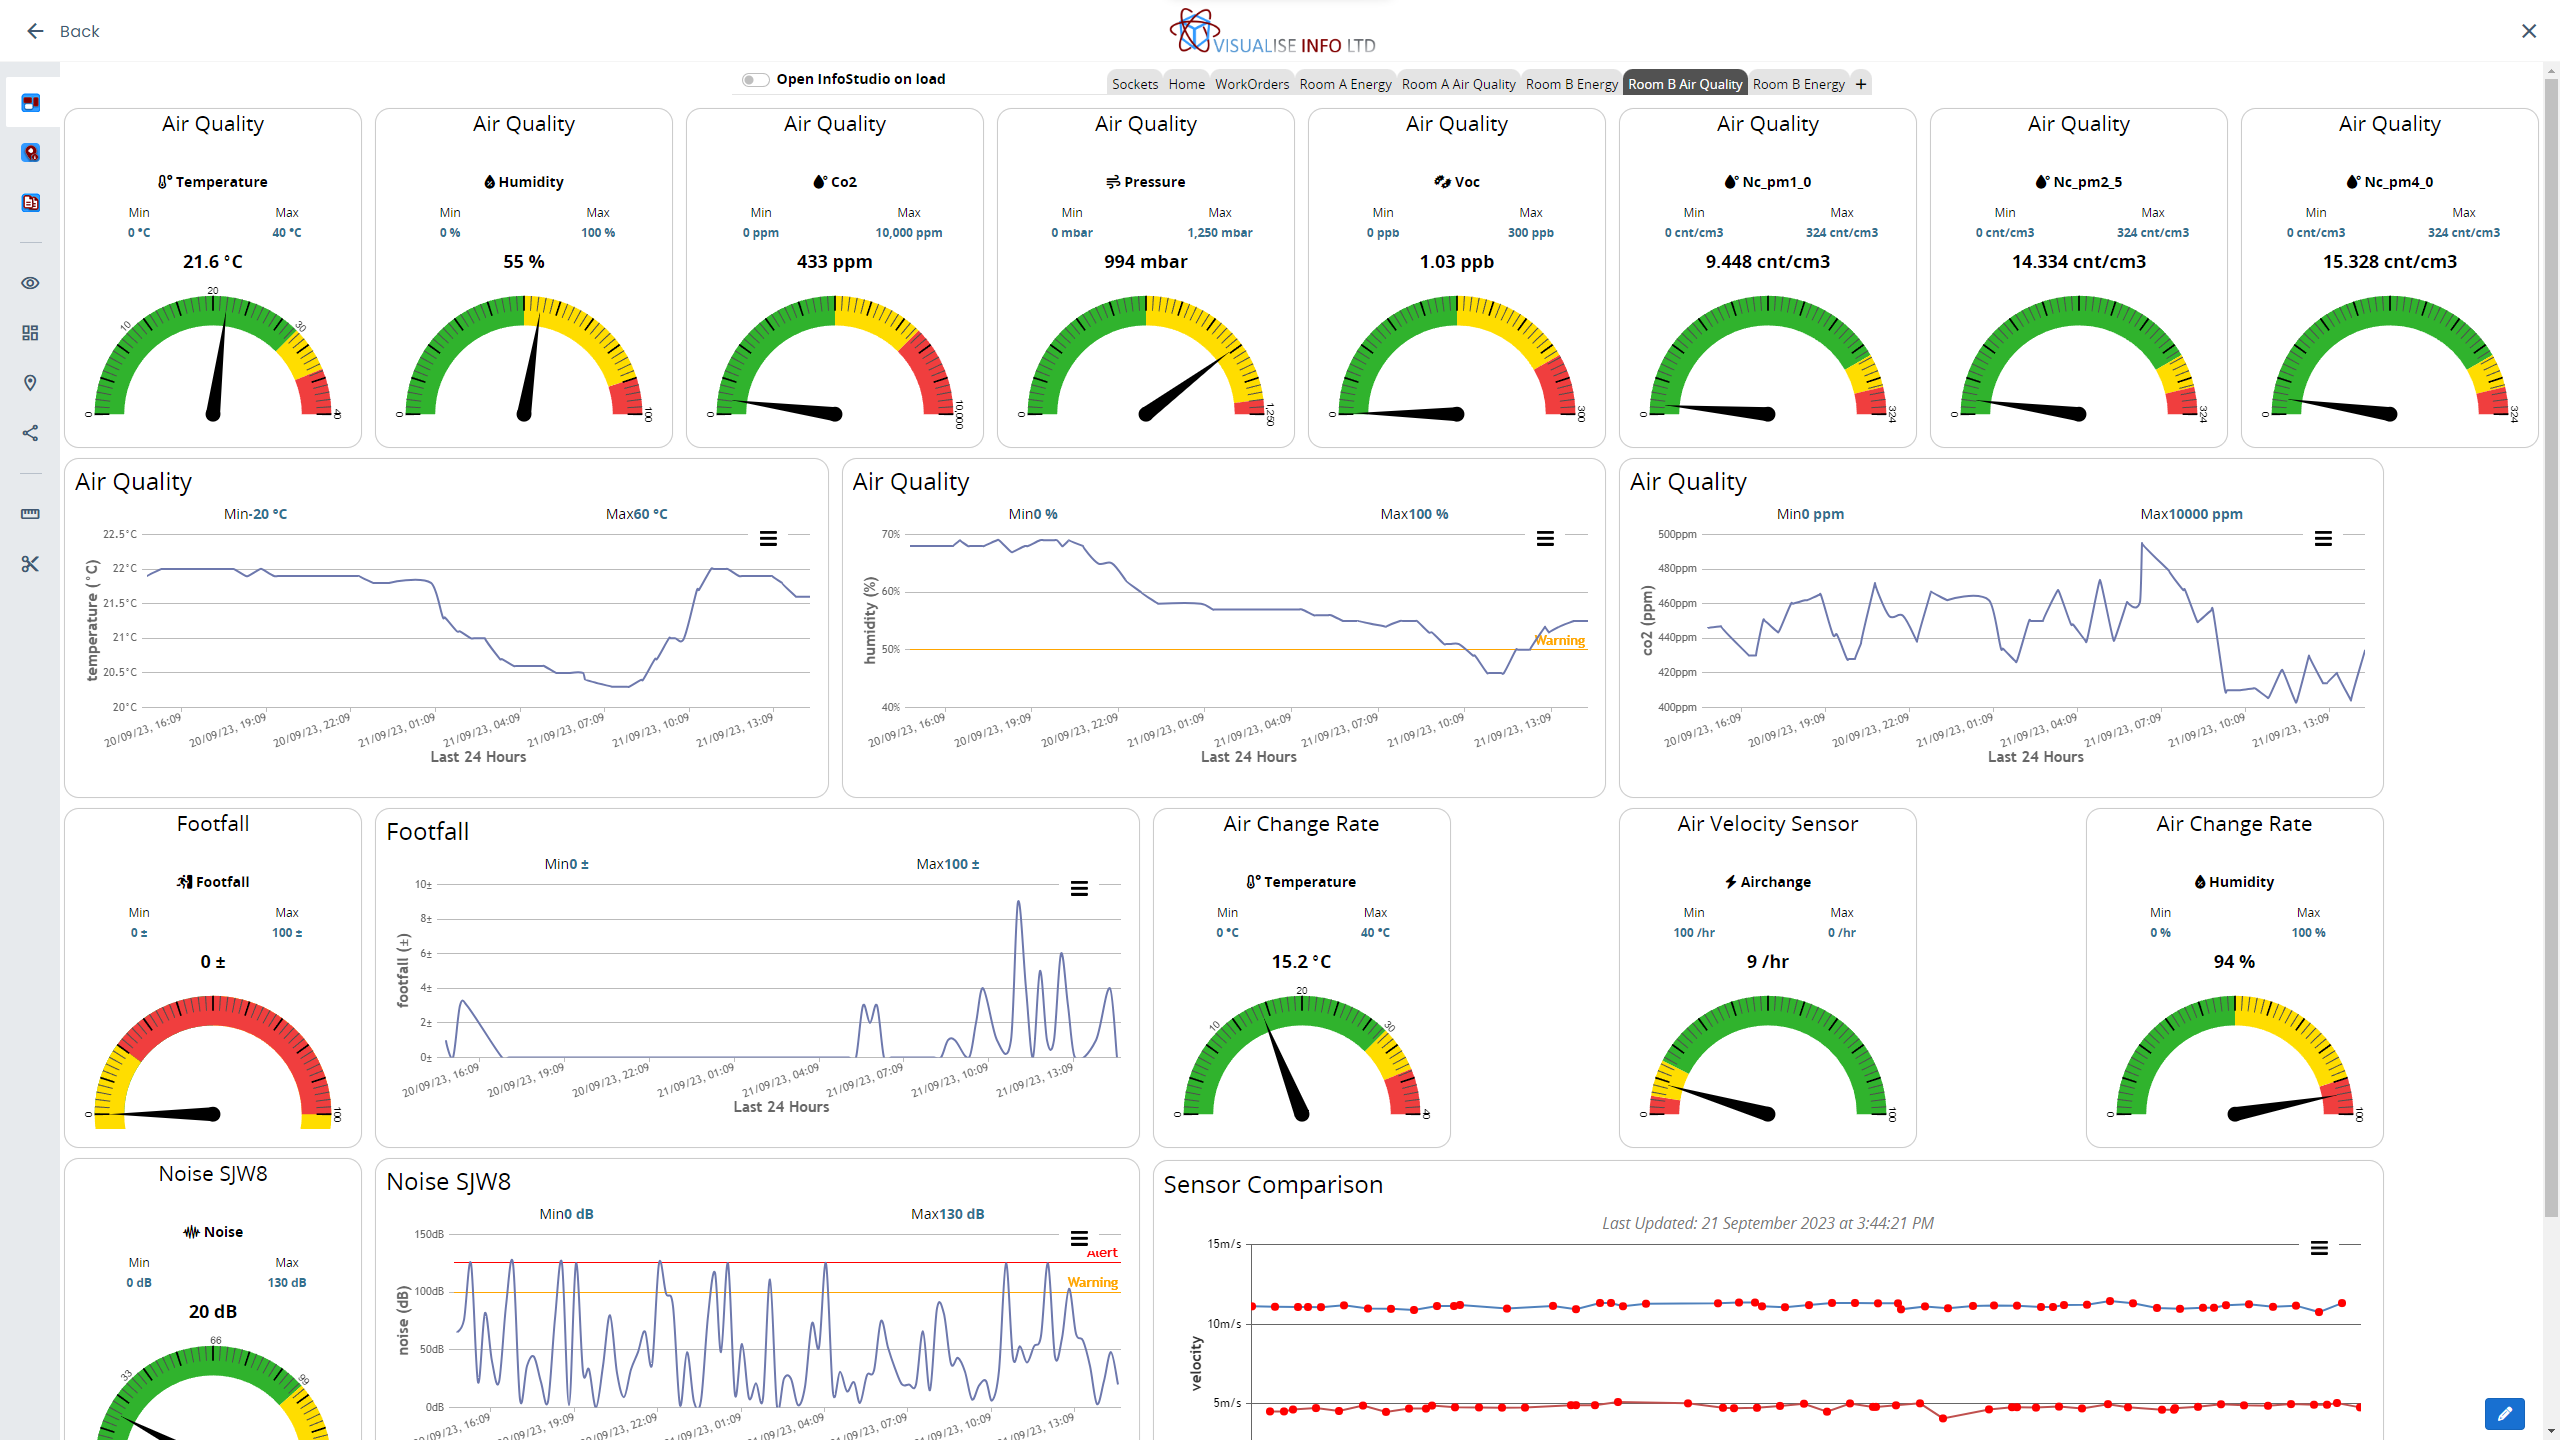
Visualisation for Optimising Business Results
Organisations can significantly elevate their business performance and operational excellence by applying advanced visualisation techniques to enterprise asset management. This intuitive approach, combined with an exact visual representation of the surroundings, streamlines workflows, propels condition-based maintenance and maximises the 'first-time fix rates of maintenance work and zero downtime. Interactive dashboards draw from various data sources and integrated systems to present a real-time visual panorama of asset status, trends, and metrics, enabling stakeholders to pinpoint performance discrepancies swiftly and craft targeted improvement strategies. Moreover, predictive analytics, fueled by sophisticated machine learning models, project future asset performance, facilitating proactive maintenance and strategic resource reallocation. Geospatial mapping delivers critical insights for managing geographically dispersed assets, optimising supply chains, and streamlining field operations. Visual tools highlight the interplay between asset performance and operational factors, guiding strategic interventions. Collectively, these visualisation strategies boost the precision of decision-making and augment asset management practices' overall efficiency and efficacy, positioning organisations at the forefront of business excellence.
Conclusion
Visualisation is an innovative problem-solving technology that dramatically enhances data analysis and strategic decision-making in business combined with IoT sensing and a SMART data interpretation engine. By adopting advanced tools, businesses position themselves for robust growth and long-term success in a digitally driven landscape.